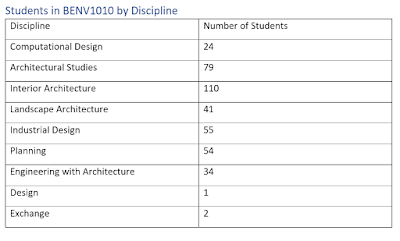
This lesson we were required to utilise one of the five sets of data provided to generate a graph to visually represent this data using adobe illustrator. This application was one which I was not very familiar with and posed a challenging. although it was difficult at first to locate all the tools and how they correspond to different things, it was highly beneficial and allowed me to generate a graph which clearly illustrated the relevant information in a clear and concise manner. the challenge for this assignment will be to place all the elements together when all five of the individual photoshop designs have to be combined for the final assessment in week 5.
Data provided -
Inspiration image -
Illustrator version of the data -


No comments:
Post a Comment